
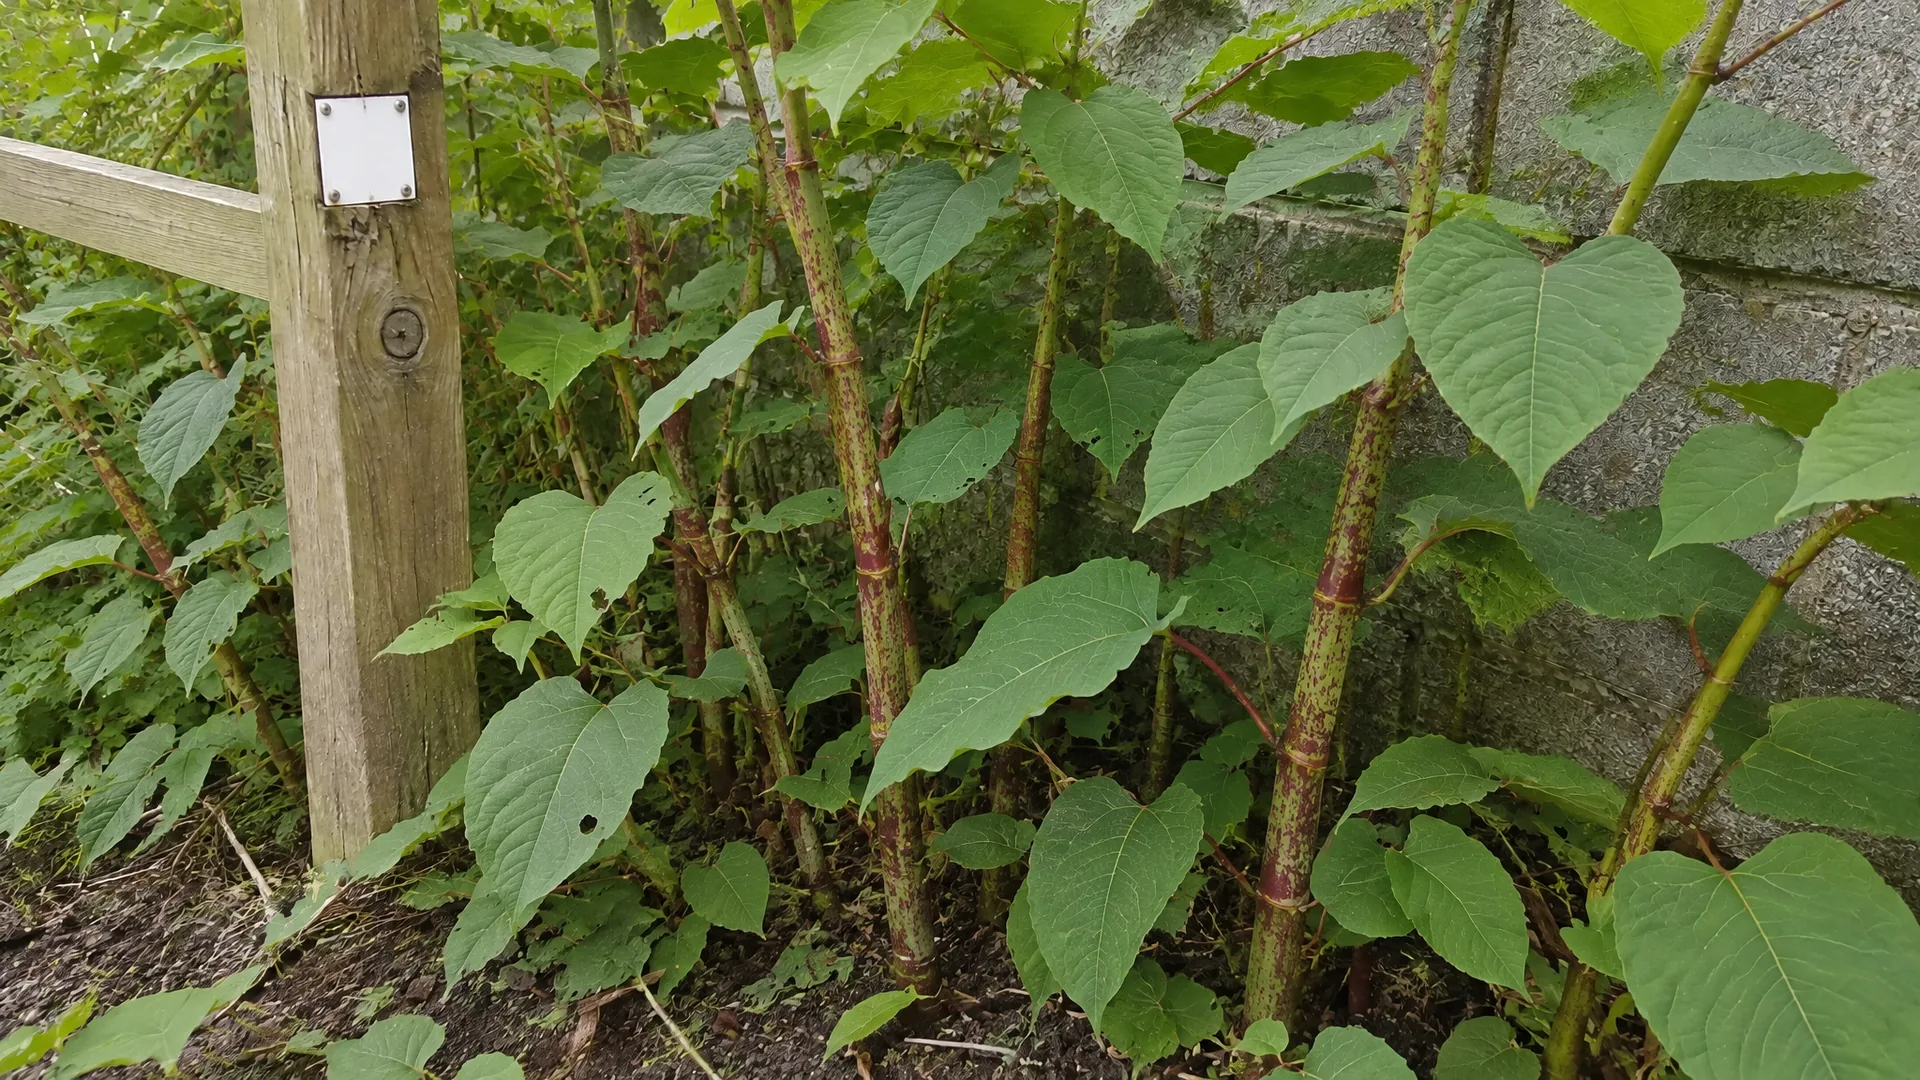
 ILLUSTRATIVE
01 / TIME
Measure change over time.
Time-stamped photos from the same fixed point, visit after visit. Knotweed creeping to a boundary, dry rot spreading under a floor, a bank eroding. Slow change becomes visible, measured and dated.
- A fixed reference point and an agreed repeat schedule
- Side-by-side, dated comparisons of every visit
- A plain record of what changed, by how much and when
For homeowners, estates, housing associations, councils, riverbanks and construction sites.



Hear the backlash
before it becomes a headline.
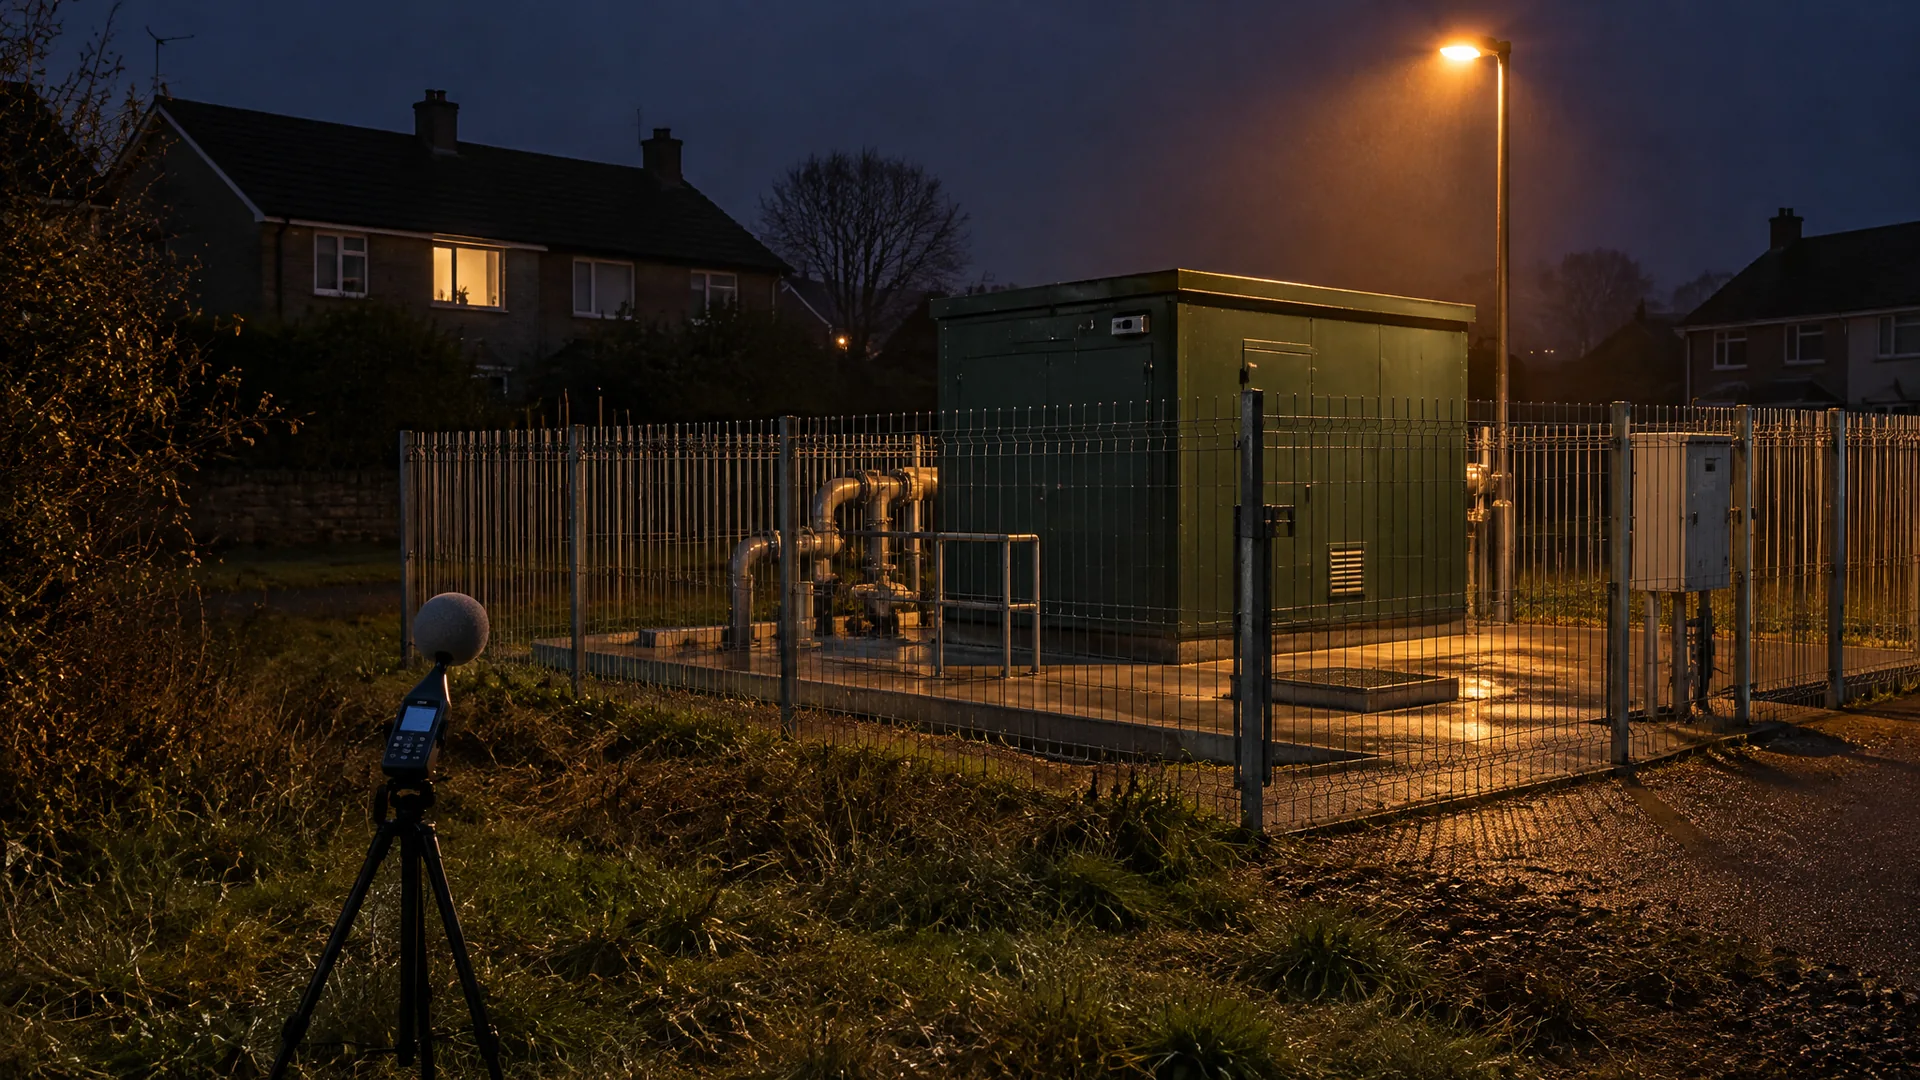
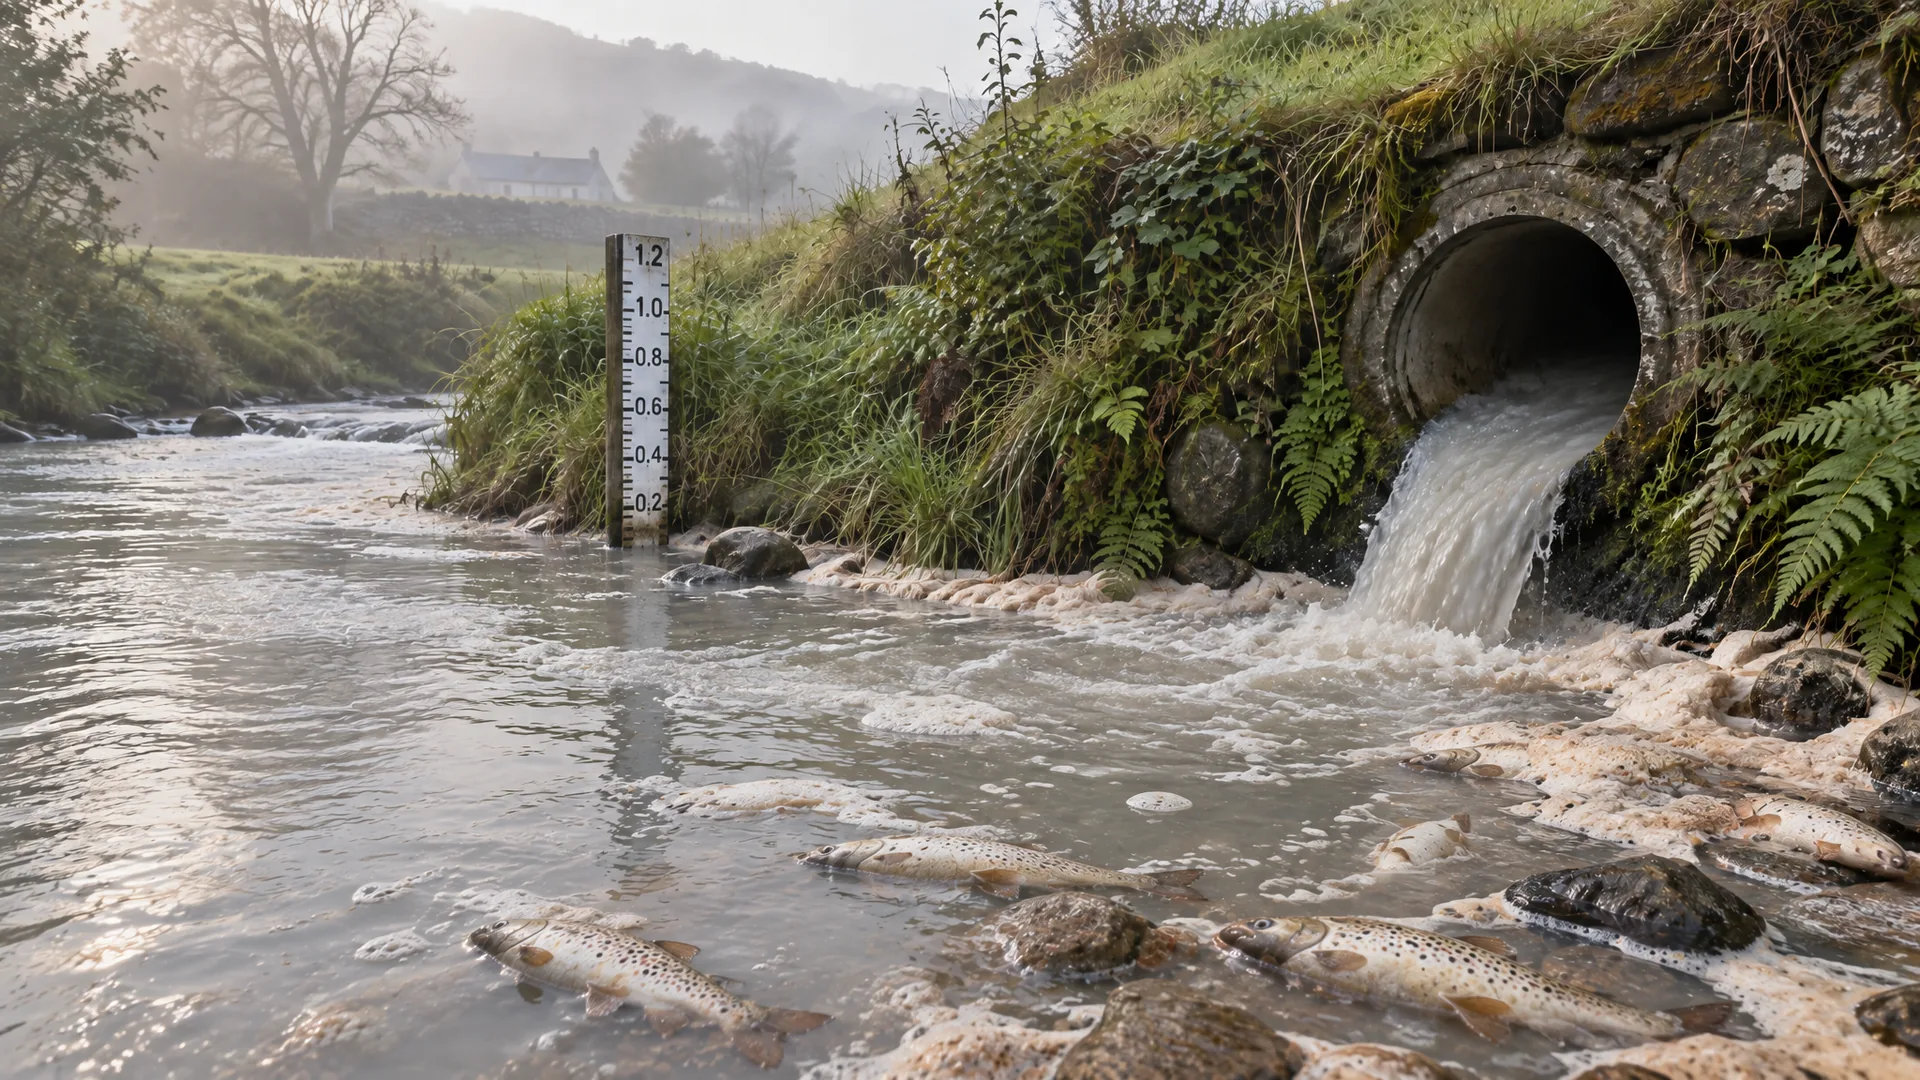
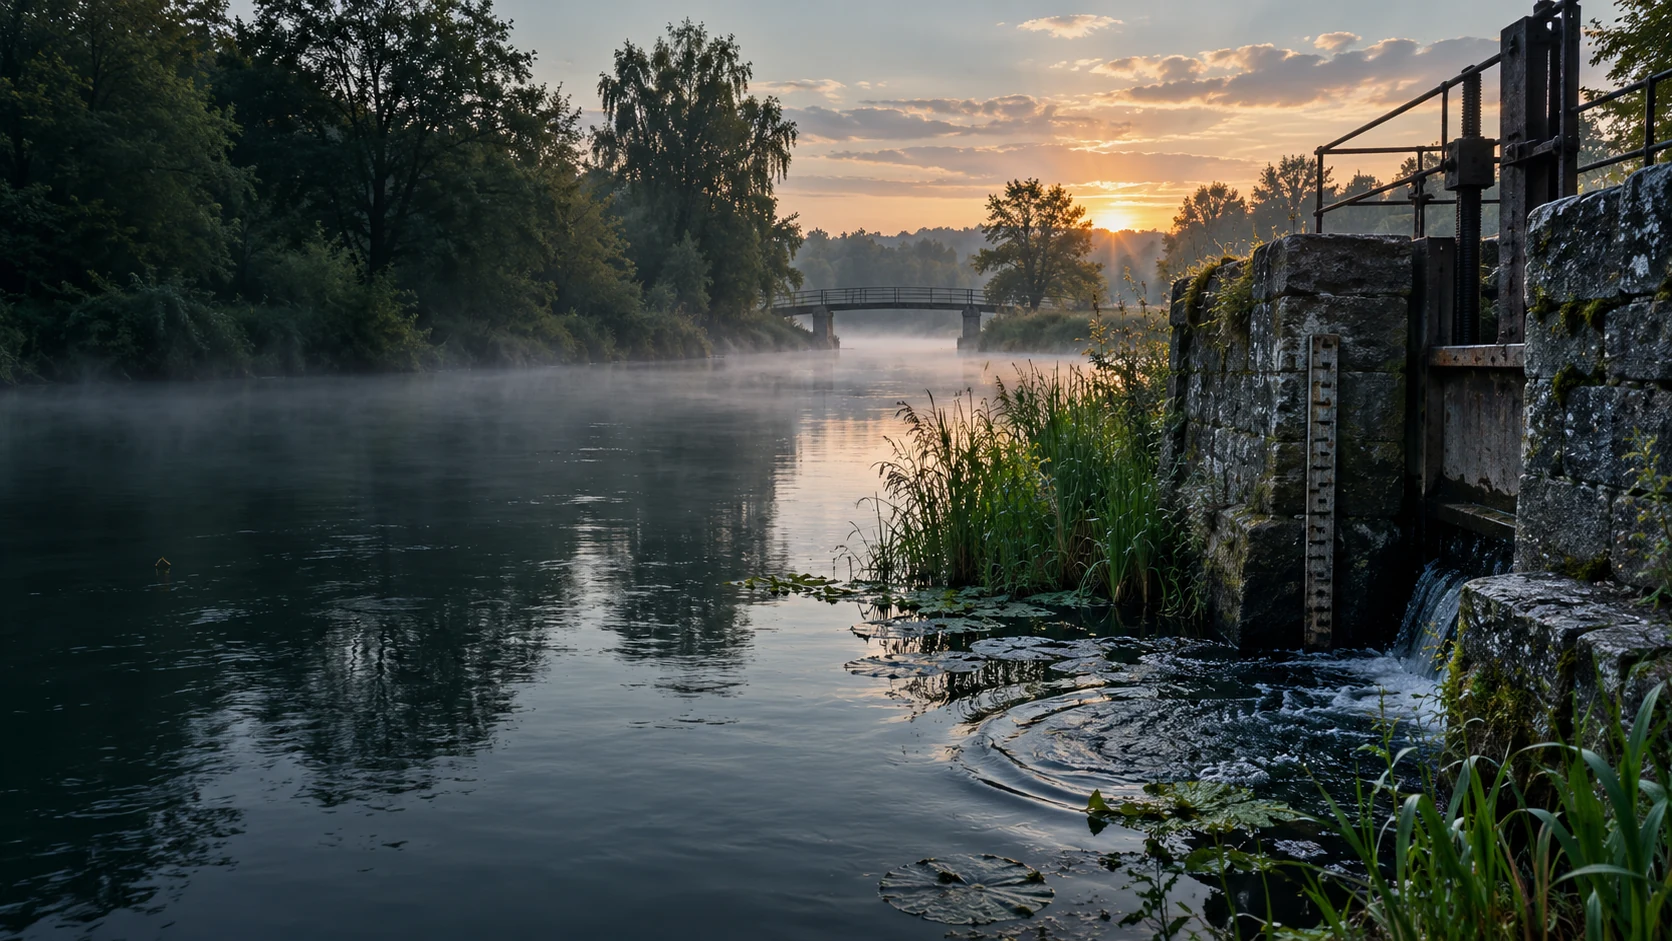
Complaints rarely start with a formal letter. They start with a post in a local community group, a forum thread, a video of a brown river or a one-star review. We follow the public conversation about your place, line it up with what the instruments measured and what operations logged, and tell you early which concerns are growing and whether the evidence supports them.
Early warning on day 4. Mentions tripled and line up with a measured H₂S peak and a logged overflow. That leaves a week to respond with facts before the video on day 11.
Public social posts, local news comments, review sites and your own complaints inbox, filtered to your place and the words people actually use: smell, hum, foam, drone, crack.
Each post is dated and placed beside the tile readings, instrument data and operating logs. You can see what matches, what conflicts and what nothing explains yet.
A weekly brief, plus an alert when a concern starts to grow. You can answer with evidence, fix the cause, or show calmly where a worry isn’t supported.
We only use publicly available posts and sources you share with us, handled under GDPR. People are not profiled. A post tells you what someone experienced or believes. It does not establish what happened, so treat online sentiment as a signal, not a verdict.